
Too many school leaders have not yet embraced the power of “Learning Analytics“ and data to guide the turnaround and transformation of their schools.
When a school leader is faced with the challenge of turning around or transforming a low performing school they may try many tools, techniques, technologies and strategies. But without a solid data and information infrastructure school leaders are flying blind. Without an understanding of the school’s current “fundamentals,” leaders planning turnaround strategies cannot easily determine what is and is not working well or where they can focus to get the greatest short term impact.
Business turnaround as a model for schools
K – 12 public school leaders should adopt proven tools widely used in successful business turnarounds. In the private sector business turnaround happens often. Failing businesses bring in outside expertise to enhance their staff, build analytics capacity quickly and then focus on strategies of rapid and measurable improvement.
Business leaders use key performance indicators (KPIs) so that they can measure progress toward goals and analyze the results of specific initiatives. For most 21st century large businesses, using indicators to monitor progress is part of the day-to-day business operations culture. School leaders, taking the bold step to transform a school from low performing to high achieving, should consider adopting proven practices using analytics to drive change and data driven instructional insight to become part of the school leadership culture.
Outsourcing Learning Analytics – An Option for School Leaders in Transformation
Consider a few of the many benefits of adopting Learning Analytics:
- Facilitate the use of personalized learning, proven to advance student performance scores
- Provide detailed student grouping strategies for differentiation, RTI and enrichment
- Deliver student by student personalized learning plans
- Assist teachers in their evaluation of lesson plans and classroom practice
- Provide overall metrics of change and the efficacy of turnaround strategies
- Facilitate budgeting and resource allocation based on objective measures
- Develop predictive models of students at risk
An information rich school culture that is using Learning Analytics effectively is facilitated by:
- easy access to relevant available data,
- access to a team of skilled trained analysts,
- strategists available that can translate data into actionable strategies and
- school leaders trained in using strategic information to allocate limited resources
Research Demonstrates Success
Although many schools that we have worked with talk about being data driven, school leaders often use data superficially and have not created a school-wide culture or technological infrastructure where data, learning analytics and predictive modeling are used to create instructional insights that can deliver rapid double digit year over year increases in student performance scores.
Creating a data driven achievement culture is a process that may take a few years depending on the school’s starting point. It can be done. It has been done. (See an example here). And school leaders ready to think out of the box can begin the process of building a data infrastructure that can be used for years to come.
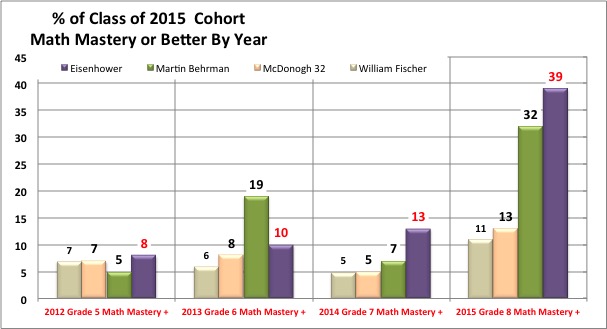
In the Ed Inquiry Video Case Study, Dwight Eisenhower Academy Charter in New Orleans (seen in purple above) adopted a data rich blended learning campaign to boost its math scores in 2013-2015, realizing the need for rapid change to accommodate the increased rigor of the new Louisiana PARCC test and Common Core standards. The results for the graduating cohort for 2015 is clear and can be seen in the graph above. In the last year a jump of more than 26% points highlight the impact of data driven grouping strategies combined with an online campaign to close math skills gaps. Martin Behrman (seen in green above) is one of the highest performing schools in New Orleans and was used as a comparison along with two other schools in the same charter network.
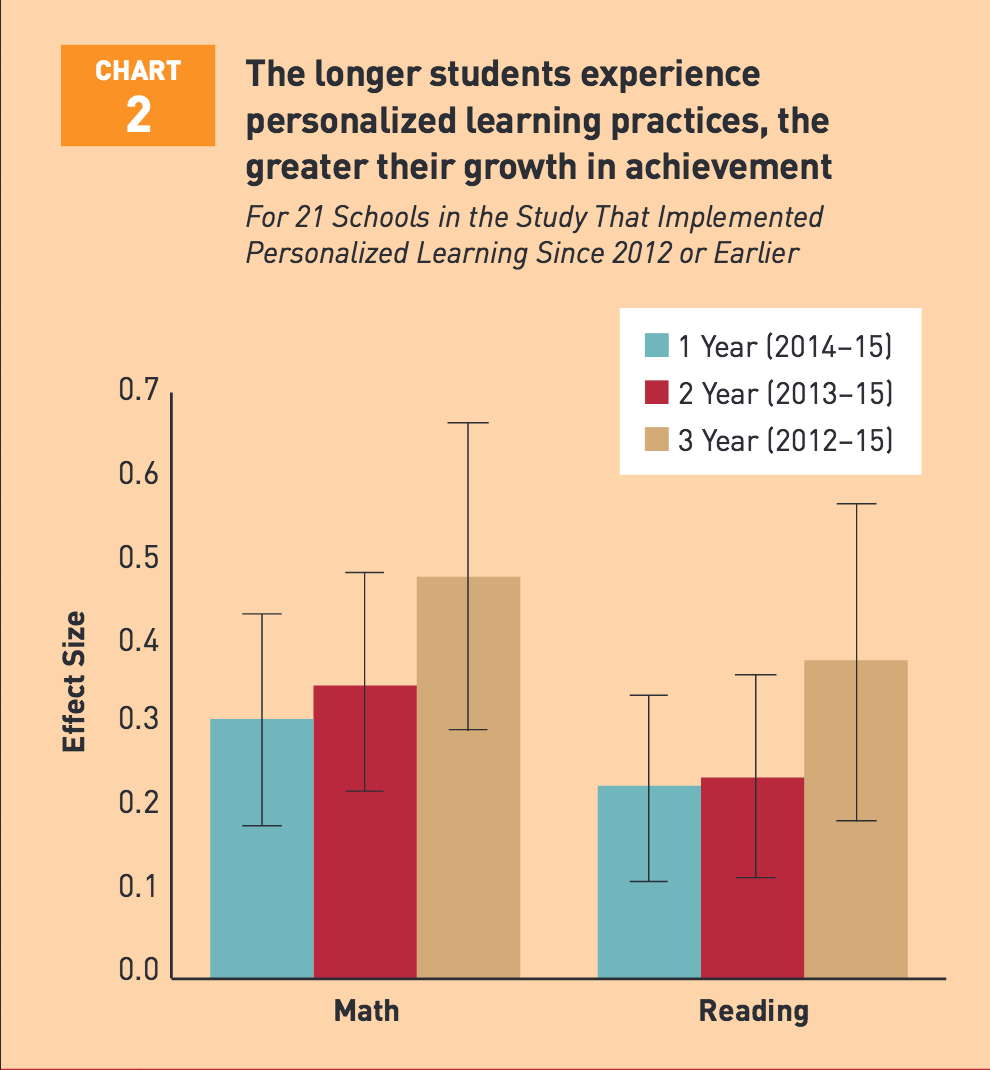
A recent report, Continued Progress, funded by the Bill and Melinda Gates Foundation, shared the promising evidence of personalized learning to close the gaps in lower performing schools. The report states: “For the 62 schools for which two years’ worth of student achievement data were available, this study found that students attending these schools made gains in mathematics and reading over the past two years that were significantly greater than a comparison group made up of similar students selected from comparable schools.” See Chart below from the report.
Creating the Capacity for Learning Analytics
The task of data analysis is often minimized by school leaders unfamiliar with the power of learning analytic strategies. Data is used, but inefficiently, and its dissemination across the school possibly left to one or two individuals in the school community that may have skills in using spreadsheets or in downloading reports from various online sources used by the school. Many school leaders are overwhelmed with the flood of data that is not integrated, that does not relate to the immediate challenges and does not provide them with the information needed to maximize the limited resources and time they have to make changes in their school building.
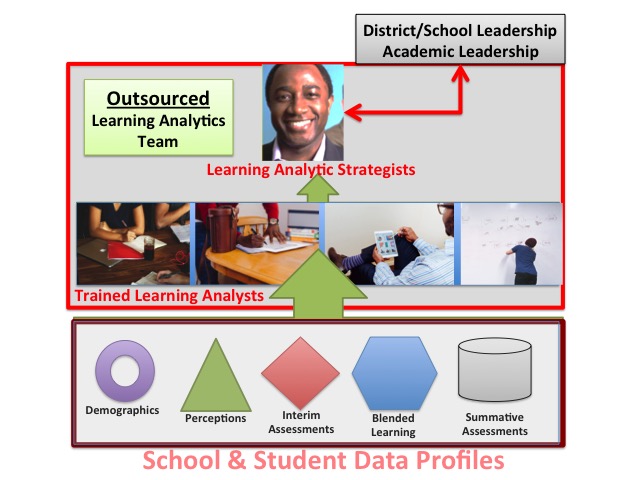
![]()
Ed Inquiry Learning Analytics Hierarchy
Adopting a data culture is not easy. No matter how much a school claims to be data driven – there are few that have created the operations infrastructure needed to use data effectively. In the diagram above we propose the Ed Inquiry Learning Analytics Hierarchy so that school leaders can determine where their school stands on the road to building a data driven learning analytics culture.
Starting from the bottom level of the triangle, we have found that many schools do not have data systems that are integrated and accessible. In the first 3 levels of the Learning Analytics Hierarchy, schools are not systematically collecting data. States require that schools provide periodic data reports on enrollment, special education services or other data needed to comply with federal or state funding requirements. Schools often relegate this data collection and distribution to an administrator that is using spreadsheets or gathering reports from tools such as Powerschool. The data is disjointed, in multiple files and not informative to those planning for turnaround or improvements in classroom instruction.
Schools that have only achieved the first lower 3 levels in the Learning Analytics Hierarchy do not have a culture of data analytics and therefore are far removed from the instructional benefits that can be gained by Learning Analytics.
Schools that have moved to Level 4 in the Hierarchy – Systematic Data Collection – recognize the benefits of using data to inform their operations and instruction. At this level a school may have policies about what data is to be collected and how it will be shared with both leadership and teachers to help them in their daily practice. Student data may be flowing from many platforms and stored in many formats with many sources. Reports from each of these sources may be used by teachers and others to group students, gauge overall effectiveness of instruction or evaluate the effectiveness of curriculum against standards. But at stage 4, school leaders may find that they are still overwhelmed with data provided to them in formats that make comparisons and analysis difficult or impossible.
School leaders that are operating at Level 5 – Integrated Data Collection – have taken on the task of developing a more integrated set of data, information and reports. Some may have invested in school-wide data platforms while others may have created a small team of dedicated analysts that are both collecting and reporting on key data for the school community. For schools that recognize the true benefit of learning analytics, reaching Level 5 is a major stepping stone to a more comprehensive use of data and information to drive change.
Schools that have reached level 6 – 8 in the Ed Inquiry Learning Analytics Hierarchy are most able to use the various data flows related to student performance for greatest impact. Many of these schools supplement the traditional summative student assessment data with a program of periodic subject matter benchmarks, student and faculty surveys and data from technology tools. Analysts use the entire data set to assist school leaders throughout the year as they review programs and placement of students in specific interventions and enrichment programs.
Consider Outsourcing to Leap Frog Forward
To get started on the road to Learning Analytics, school leaders should consider whether it is best to build the capacity for learning analytics or to outsource the analysis. Using outside expertise for analysis in the short term allows school leaders to receive the benefits of Learning Analytics while they embark on the multi-year transformation of their school culture building the internal capacity for analysis.
The benefits of Learning Analytics have been well documented and researched. The question school leaders should ask is what is the best way to start to use data and learning analytics to drive performance?
To learn more about Ed Inquiry check out our web site. To learn more about our video case studies regarding learning analytics and personalized learning click here.